Mobile Gaming is still a big money maker, and in-app store purchases make for big business.
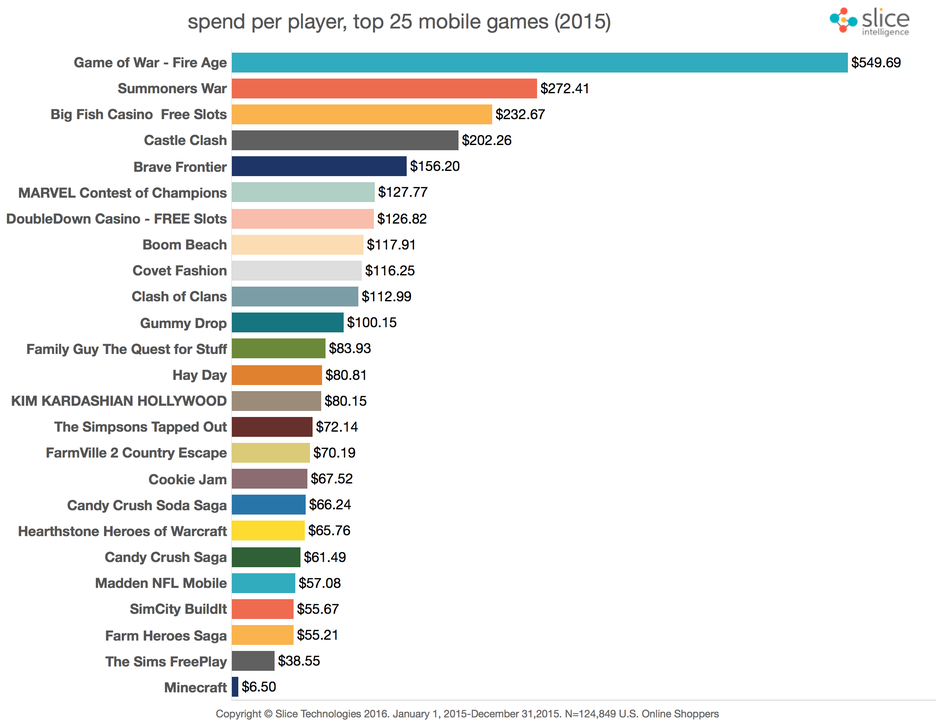
A report by Slice Intelligence, a digital commerce analyst, shows mobile gaming has been picking up steam by netting an average $87 for in-app purchases on free-to-play games by paying customers, according to a panel of over 4 million online shoppers in the United States in 2015. Out of those 4 million shoppers, close to 125,000 would spend money on the top 25 mobile games listed below.
Some of the games are also off the charts; one mobile game, Game of War - Fire Age, has spending players spend on average $550, mostly buying crates of in-game gold that cost an average price of $57. Other perennial favorites include Hearthstone, Candy Crush Saga, Simpsons Tapped Out and Clash of Clans. Minecraft is also on the list of the top 25 big spenders, but has a small buyrate of only $6.50 on average.
It should be noted that Slice Intelligence acquired this data from e-receipts, which allows Slice to gather data from "comprehensive shopping behavior across multiple devices, over time which are key in an increasingly omnichannel retail world."
Another interesting statistic is how mobile gaming is standing up to the buying power of "traditional games." On average, Slice has found that players who tend to buy PC and console games only spend about $5 more than mobile. Mobile gaming also has a larger audience today; 43% of the gaming market is only mobile gaming, with consoles and PC gaming purists at $37.8. There is a fair amount of crossover between them, Slice estimates that around 19% of the market plays both mobile and traditional games.
Most of this in-game purchasing is from "whales" that make up roughly 10% of the entire mobile gaming customer base. This 10% is responsible for roughly 90% of the in-app purchases. Even more detailed analysis sees the top 1% of those whales, called "white whales" by Slice, make up 58% of mobile game revenue. The split is much different with more traditional games, which see only 28% of the audience accounts for 90% of game sales.
There appears to be a massive split between the top 25 games on the market, a
Most of the mobile spending trends are fueled by free-to-play models that allow for in-app purchases at varying increments. Some games have been critically and publicly panned for including microtransactions because of their paywall structure or for being a pay-to-win model. Console and PC games have also come under fire for including microtransactions as well, although only a few games have been fully intrusive in the same vein as some mobile games.
So what do you think about all of this data? Leave your comments below